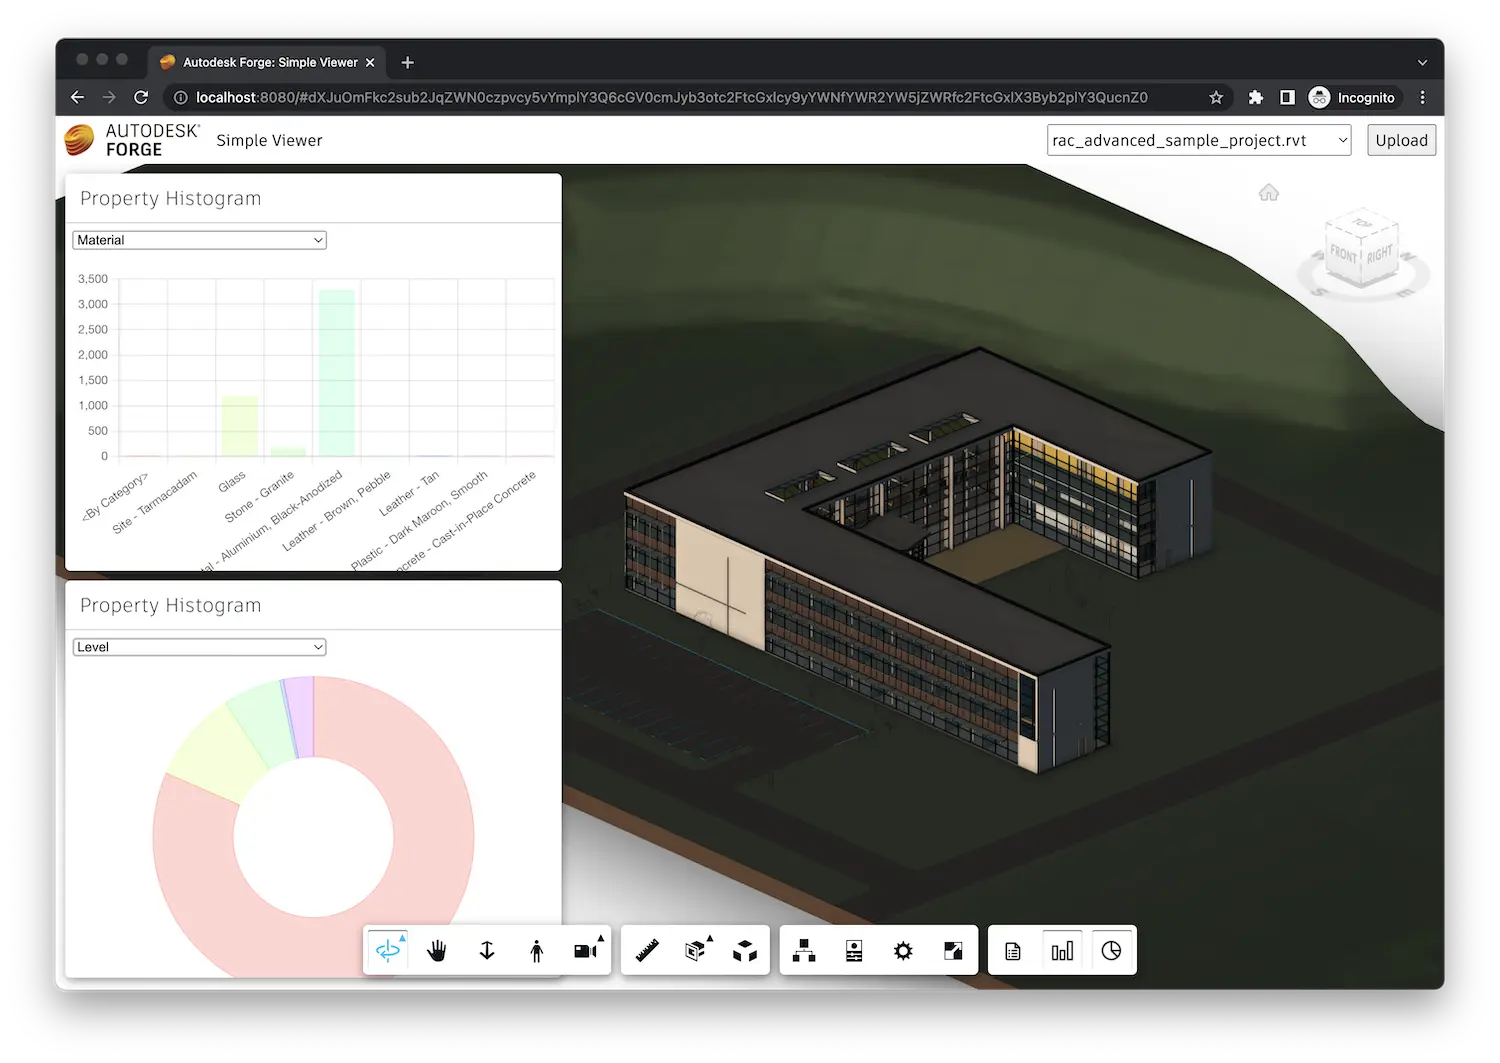
Histogram Charts
In this step we will create a viewer extension that will display a histogram of values for a specific property across all design elements. We will use the open source library Chart.js to display the histograms as bar charts and pie charts.
Extension skeleton
Just like in previous steps, let's create a new file under the extensions subfolder,
call it HistogramExtension.js, and populate it with the following code:
import { BaseExtension } from './BaseExtension.js';

class HistogramExtension extends BaseExtension {
    constructor(viewer, options) {
        super(viewer, options);
    }

    async load() {
        super.load();
        console.log('HistogramExtension loaded.');
        return true;
    }

    unload() {
        super.unload();
        console.log('HistogramExtension unloaded.');
        return true;
    }

    async findPropertyValueOccurrences(model, propertyName) {
        const dbids = await this.findLeafNodes(model);
        return new Promise(function (resolve, reject) {
            model.getBulkProperties(dbids, { propFilter: [propertyName] }, function (results) {
                let histogram = new Map();
                for (const result of results) {
                    if (result.properties.length > 0) {
                        const key = result.properties[0].displayValue;
                        if (histogram.has(key)) {
                            histogram.get(key).push(result.dbId);
                        } else {
                            histogram.set(key, [result.dbId]);
                        }
                    }
                }
                resolve(histogram);
            }, reject);
        });
    }
}

Autodesk.Viewing.theExtensionManager.registerExtension('HistogramExtension', HistogramExtension);
Apart from the standard extension scaffolding, we have also defined a findPropertyValueOccurrences
helper method that we will later use to collect the desired data (number of occurrences of a specific
property value, and which objects contain this value) for our charts.
Now let's import the JavaScript file to our application, and pass the extension ID to the viewer constructor:
import './extensions/LoggerExtension.js';
import './extensions/SummaryExtension.js';
import './extensions/HistogramExtension.js';
const config = {
    extensions: [
        'LoggerExtension',
        'SummaryExtension',
        'HistogramExtension',
    ]
};
const viewer = new Autodesk.Viewing.GuiViewer3D(container, config);
Toolbar
Next, let's update the HistogramExtension class so that it adds two new buttons to the viewer
toolbar, one for showing a bar chart, and another one for showing a pie chart:
import { BaseExtension } from './BaseExtension.js';

class HistogramExtension extends BaseExtension {
    constructor(viewer, options) {
        super(viewer, options);
        this._barChartButton = null;
        this._pieChartButton = null;
    }

    async load() {
        super.load();
        console.log('HistogramExtension loaded.');
        return true;
    }

    unload() {
        super.unload();
        for (const button of [this._barChartButton, this._pieChartButton]) {
            this.removeToolbarButton(button);
        }
        this._barChartButton = this._pieChartButton = null;
        console.log('HistogramExtension unloaded.');
        return true;
    }

    onToolbarCreated() {
        this._barChartButton = this.createToolbarButton('dashboard-barchart-button', 'https://img.icons8.com/small/32/bar-chart.png', 'Show Property Histogram (Bar Chart)');
        this._barChartButton.onClick = () => {
            // TODO
        };
        this._pieChartButton = this.createToolbarButton('dashboard-piechart-button', 'https://img.icons8.com/small/32/pie-chart.png', 'Show Property Histogram (Pie Chart)');
        this._pieChartButton.onClick = () => {
            // TODO
        };
    }

    async findPropertyValueOccurrences(model, propertyName) {
        const dbids = await this.findLeafNodes(model);
        return new Promise(function (resolve, reject) {
            model.getBulkProperties(dbids, { propFilter: [propertyName] }, function (results) {
                let histogram = new Map();
                for (const result of results) {
                    if (result.properties.length > 0) {
                        const key = result.properties[0].displayValue;
                        if (histogram.has(key)) {
                            histogram.get(key).push(result.dbId);
                        } else {
                            histogram.set(key, [result.dbId]);
                        }
                    }
                }
                resolve(histogram);
            }, reject);
        });
    }
}

Autodesk.Viewing.theExtensionManager.registerExtension('HistogramExtension', HistogramExtension);
Dependency loading
Our extension will need to somehow fetch the dependencies of the Chart.js library. Since this (getting dependencies
of a 3rd party library) might be needed in other extensions as well, we will update the BaseExtension class with
a couple more helper methods that will handle this:
export class BaseExtension extends Autodesk.Viewing.Extension {
    constructor(viewer, options) {
        super(viewer, options);
        this._onObjectTreeCreated = (ev) => this.onModelLoaded(ev.model);
        this._onSelectionChanged = (ev) => this.onSelectionChanged(ev.model, ev.dbIdArray);
        this._onIsolationChanged = (ev) => this.onIsolationChanged(ev.model, ev.nodeIdArray);
    }

    load() {
        this.viewer.addEventListener(Autodesk.Viewing.OBJECT_TREE_CREATED_EVENT, this._onObjectTreeCreated);
        this.viewer.addEventListener(Autodesk.Viewing.SELECTION_CHANGED_EVENT, this._onSelectionChanged);
        this.viewer.addEventListener(Autodesk.Viewing.ISOLATE_EVENT, this._onIsolationChanged);
        return true;
    }

    unload() {
        this.viewer.removeEventListener(Autodesk.Viewing.OBJECT_TREE_CREATED_EVENT, this._onObjectTreeCreated);
        this.viewer.removeEventListener(Autodesk.Viewing.SELECTION_CHANGED_EVENT, this._onSelectionChanged);
        this.viewer.removeEventListener(Autodesk.Viewing.ISOLATE_EVENT, this._onIsolationChanged);
        return true;
    }

    onModelLoaded(model) {}

    onSelectionChanged(model, dbids) {}

    onIsolationChanged(model, dbids) {}

    findLeafNodes(model) {
        return new Promise(function (resolve, reject) {
            model.getObjectTree(function (tree) {
                let leaves = [];
                tree.enumNodeChildren(tree.getRootId(), function (dbid) {
                    if (tree.getChildCount(dbid) === 0) {
                        leaves.push(dbid);
                    }
                }, true);
                resolve(leaves);
            }, reject);
        });
    }

    async findPropertyNames(model) {
        const dbids = await this.findLeafNodes(model);
        return new Promise(function (resolve, reject) {
            model.getBulkProperties(dbids, {}, function (results) {
                let propNames = new Set();
                for (const result of results) {
                    for (const prop of result.properties) {
                        propNames.add(prop.displayName);
                    }
                }
                resolve(Array.from(propNames.values()));
            }, reject);
        });
    }

    createToolbarButton(buttonId, buttonIconUrl, buttonTooltip) {
        let group = this.viewer.toolbar.getControl('dashboard-toolbar-group');
        if (!group) {
            group = new Autodesk.Viewing.UI.ControlGroup('dashboard-toolbar-group');
            this.viewer.toolbar.addControl(group);
        }
        const button = new Autodesk.Viewing.UI.Button(buttonId);
        button.setToolTip(buttonTooltip);
        group.addControl(button);
        const icon = button.container.querySelector('.adsk-button-icon');
        if (icon) {
            icon.style.backgroundImage = `url(${buttonIconUrl})`;
            icon.style.backgroundSize = `24px`;
            icon.style.backgroundRepeat = `no-repeat`;
            icon.style.backgroundPosition = `center`;
        }
        return button;
    }

    removeToolbarButton(button) {
        const group = this.viewer.toolbar.getControl('dashboard-toolbar-group');
        group.removeControl(button);
    }

    loadScript(url, namespace) {
        if (window[namespace] !== undefined) {
            return Promise.resolve();
        }
        return new Promise(function (resolve, reject) {
            const el = document.createElement('script');
            el.src = url;
            el.onload = resolve;
            el.onerror = reject;
            document.head.appendChild(el);
        });
    }

    loadStylesheet(url) {
        return new Promise(function (resolve, reject) {
            const el = document.createElement('link');
            el.rel = 'stylesheet';
            el.href = url;
            el.onload = resolve;
            el.onerror = reject;
            document.head.appendChild(el);
        });
    }
}
Charts
Now let's create another custom panel that will host the actual chart graphics. Create a HistogramPanel.js
file in the same folder where HistogramExtension.js is located, and add the following code to it:
export class HistogramPanel extends Autodesk.Viewing.UI.DockingPanel {
    constructor(extension, id, title, options) {
        super(extension.viewer.container, id, title, options);
        this.extension = extension;
        this.container.style.left = (options.x || 0) + 'px';
        this.container.style.top = (options.y || 0) + 'px';
        this.container.style.width = (options.width || 500) + 'px';
        this.container.style.height = (options.height || 400) + 'px';
        this.container.style.resize = 'none';
        this.chartType = options.chartType || 'bar'; // See https://www.chartjs.org/docs/latest for all the supported types of charts
        this.chart = this.createChart();
    }

    initialize() {
        this.title = this.createTitleBar(this.titleLabel || this.container.id);
        this.initializeMoveHandlers(this.title);
        this.container.appendChild(this.title);
        this.content = document.createElement('div');
        this.content.style.height = '350px';
        this.content.style.backgroundColor = 'white';
        this.content.innerHTML = `
            <div class="props-container" style="position: relative; height: 25px; padding: 0.5em;">
                <select class="props"></select>
            </div>
            <div class="chart-container" style="position: relative; height: 325px; padding: 0.5em;">
                <canvas class="chart"></canvas>
            </div>
        `;
        this.select = this.content.querySelector('select.props');
        this.canvas = this.content.querySelector('canvas.chart');
        this.container.appendChild(this.content);
    }

    createChart() {
        return new Chart(this.canvas.getContext('2d'), {
            type: this.chartType,
            data: {
                labels: [],
                datasets: [{ data: [], backgroundColor: [], borderColor: [], borderWidth: 1 }],
            },
            options: { maintainAspectRatio: false }
        });
    }

    async setModel(model) {
        const propertyNames = await this.extension.findPropertyNames(model);
        this.select.innerHTML = propertyNames.map(prop => `<option value="${prop}">${prop}</option>`).join('\n');
        this.select.onchange = () => this.updateChart(model, this.select.value);
        this.updateChart(model, this.select.value);
    }

    async updateChart(model, propName) {
        const histogram = await this.extension.findPropertyValueOccurrences(model, propName);
        const propertyValues = Array.from(histogram.keys());
        this.chart.data.labels = propertyValues;
        const dataset = this.chart.data.datasets[0];
        dataset.label = propName;
        dataset.data = propertyValues.map(val => histogram.get(val).length);
        if (dataset.data.length > 0) {
            const hslaColors = dataset.data.map((val, index) => `hsla(${Math.round(index * (360 / dataset.data.length))}, 100%, 50%, 0.2)`);
            dataset.backgroundColor = dataset.borderColor = hslaColors;
        }
        this.chart.update();
        this.chart.config.options.onClick = (ev, items) => {
            if (items.length === 1) {
                const index = items[0].index;
                const dbids = histogram.get(propertyValues[index]);
                this.extension.viewer.isolate(dbids);
                this.extension.viewer.fitToView(dbids);
            }
        };
    }
}
And finally, let's use the new panel class in our extension:
import { BaseExtension } from './BaseExtension.js';
import { HistogramPanel } from './HistogramPanel.js';

class HistogramExtension extends BaseExtension {
    constructor(viewer, options) {
        super(viewer, options);
        this._barChartButton = null;
        this._pieChartButton = null;
        this._barChartPanel = null;
        this._pieChartPanel = null;
    }

    async load() {
        super.load();
        await this.loadScript('https://cdnjs.cloudflare.com/ajax/libs/Chart.js/3.5.1/chart.min.js', 'Chart');
        Chart.defaults.plugins.legend.display = false;
        console.log('HistogramExtension loaded.');
        return true;
    }

    unload() {
        super.unload();
        for (const button of [this._barChartButton, this._pieChartButton]) {
            this.removeToolbarButton(button);
        }
        this._barChartButton = this._pieChartButton = null;
        for (const panel of [this._barChartPanel, this._pieChartPanel]) {
            panel.setVisible(false);
            panel.uninitialize();
        }
        this._barChartPanel = this._pieChartPanel = null;
        console.log('HistogramExtension unloaded.');
        return true;
    }

    onToolbarCreated() {
        this._barChartPanel = new HistogramPanel(this, 'dashboard-barchart-panel', 'Property Histogram', { x: 10, y: 10, chartType: 'bar' });
        this._pieChartPanel = new HistogramPanel(this, 'dashboard-piechart-panel', 'Property Histogram', { x: 10, y: 420, chartType: 'doughnut' });
        this._barChartButton = this.createToolbarButton('dashboard-barchart-button', 'https://img.icons8.com/small/32/bar-chart.png', 'Show Property Histogram (Bar Chart)');
        this._barChartButton.onClick = () => {
            this._barChartPanel.setVisible(!this._barChartPanel.isVisible());
            this._barChartButton.setState(this._barChartPanel.isVisible() ? Autodesk.Viewing.UI.Button.State.ACTIVE : Autodesk.Viewing.UI.Button.State.INACTIVE);
            if (this._barChartPanel.isVisible() && this.viewer.model) {
                this._barChartPanel.setModel(this.viewer.model);
            }
        };
        this._pieChartButton = this.createToolbarButton('dashboard-piechart-button', 'https://img.icons8.com/small/32/pie-chart.png', 'Show Property Histogram (Pie Chart)');
        this._pieChartButton.onClick = () => {
            this._pieChartPanel.setVisible(!this._pieChartPanel.isVisible());
            this._pieChartButton.setState(this._pieChartPanel.isVisible() ? Autodesk.Viewing.UI.Button.State.ACTIVE : Autodesk.Viewing.UI.Button.State.INACTIVE);
            if (this._pieChartPanel.isVisible() && this.viewer.model) {
                this._pieChartPanel.setModel(this.viewer.model);
            }
        };
    }

    onModelLoaded(model) {
        super.onModelLoaded(model);
        if (this._barChartPanel && this._barChartPanel.isVisible()) {
            this._barChartPanel.setModel(model);
        }
        if (this._pieChartPanel && this._pieChartPanel.isVisible()) {
            this._pieChartPanel.setModel(model);
        }
    }

    async findPropertyValueOccurrences(model, propertyName) {
        const dbids = await this.findLeafNodes(model);
        return new Promise(function (resolve, reject) {
            model.getBulkProperties(dbids, { propFilter: [propertyName] }, function (results) {
                let histogram = new Map();
                for (const result of results) {
                    if (result.properties.length > 0) {
                        const key = result.properties[0].displayValue;
                        if (histogram.has(key)) {
                            histogram.get(key).push(result.dbId);
                        } else {
                            histogram.set(key, [result.dbId]);
                        }
                    }
                }
                resolve(histogram);
            }, reject);
        });
    }
}

Autodesk.Viewing.theExtensionManager.registerExtension('HistogramExtension', HistogramExtension);
Try it out
Alright, time to test our charts extension in the viewer. Click on either of the new toolbar buttons. A new panel should show up with either a bar chart or a pie chart showing the histogram of different values appearing for a specific property (which you can select in the dropdown). And clicking on any bar or pie segment will then isolate all the corresponding design elements in the viewer.